This application note has been provided by our valued supplier DEWESoft.
INTRODUCTION DYNAMIC TESTING ON INDUSTRIAL SHELTER
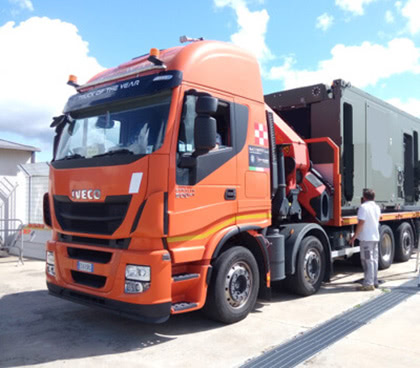
This presentation describes the dynamic testing campaign carried out, by personnel of Rina Consulting S.p.A, on an industrial shelter for telecommunications. The scope of this was to check, evaluate and improve the capacity of the shelter to dampen the vibrations that affect the antenna during transportation by truck along urban and not urban roads. This shelter can be used to ensure emergency communications during natural catastrophes (earth quakes, avalanches ..etc ). For this reason, it must have the ability to avoid damages to antenna and other systems during transportation, especially on rough roads. Tests were performed using Dewesoft Sirius 8acc and X2 software to show in real time raw data and data analysis to our client.
Two test campaigns were performed for a total of 11 measuring runs for a total of 120 km covered. At each run the constraints and the damping characteristics were changed to find best configuration able to minimise amplifications of the antenna’s vibrations. Three measuring points, two tri-axial and one bi-axial, were implemented using IEPE accelerometers and an action cam connected by USB to the laptop.
TEST CAMPAIGNS
The tested tele-communications system was designed to work stand-alone both in urban and not urban contexts. It’s made up of a shelter, containing electronics devices, generators and fuel tanks, of a system of four self-levelling legs, which permit to install it onto irregular terrains and of an extensible arm with a rotation pin on the top. The rotation pin supports a rotating antenna.
Three measuring points were installed:
- One on the “iso-corner”, to measure input accelerations to the structures. Tri-axial. Point A
- One on the pin of arm, at the base of antenna. Bi-axial (Y and Z directions). Point B
- One on the antenna, to measure accelerations response. Tri-axial. Point C Rina Consulting S.p.A. carried on all activities involved in this work:
- choice of measuring points, in accordance with client indications and necessities
- sensor chain installation
- setting of Dewesoft X2 measuring software
- data acquisition and post analysis
COMBINATIONS OF CONSTRAINTS AND DAMPERS
Tests were performed during transportation of the system with a truck for a total of 11 measuring runs. For each run, the types of constraints and damper elements were changed by client personnel. This was done to find the combination that permits to minimise movements and vibrations of the antenna.
First campaign:
- Elastic hooks at the level of the antenna rotation pin. Radome free
- Rotation pin and radome free
- Rotation pin blocked. Radome free
Second campaign:
- Rotation pin free and radome on damping mat
- Rotation pin resting on 6 dampers and radome on rigid supports
- Rotation pin resting on 6 dampers and radome free
- Rotation pin resting on 4 dampers and radome on dampened supports
- Rotation pin fixed on 4 dampers and radome on dampened support
- Not communicated by client
- Not communicated by client
- Not communicated by client
MEASURING CHAIN
Sensors and camera were fixed on measuring points by epoxy glue and by mechanical solutions. Height coaxial cable RG58 were installed from the sensors to the Sirius 8Acc, located on drive cabin. Accelerometers used were PCB 393A03 (IEEPE, 1 V/g sensitivity). Sampling rate was 1200 Hz, to assure a band of 500 Hz for data signals. Camera signals were achieved directly in Dewesoft X2, as signal sensors.
DATA ANALYSIS
As mentioned before, the main scope of this work is to quantify magnifications of antenna’s and arm’s vibrations comparing to the vibrations in going to the shelter, in iso-corner point. To perform this, sub request of client, a simple calculation of transfer function H(s) was performed on accelerometers time data.
For each measuring direction the X,Y and Z the signals of accelerometers were used to calculate H functions as HXA,B HXA,C HYA,B — HZA,C . Or, in other words, three matrices were been built, one for each measuring direction:
The H function was calculated using math instruments present in Dewesoft X2. This part of data elaboration was executed after the completions of a single run of measure.
RESULTS OF DYNAMIC TESTING
For each measuring run a set of H(s) functions was calculated for B and C points (rotation pin and antenna positions respectively) for X, Y, and Z direction:
After, to evaluate the performances of different dumping solutions , for each measuring point and for each direction, all the H(s) functions were gathered together in a Excel’s sheets&graph in terms of magnitude:
CONCLUSION
The solutions tested show various behaviours along the frequency range. No solutions tested it’s efficient on the entire spectrum. Many solutions are efficient at low frequencies but not around the value of 40 Hz (characteristic of truck’s rotating wheels). Other solutions magnify the response at very low frequencies but are more efficient in the rest of the spectrum. Anyway the results obtained during the test allowed the customer to make a choice. This has fallen on those that minimise magnification at very low frequencies (eg red, Test # 6 and #7)
For more information on this dynamic testing application note, contact us.