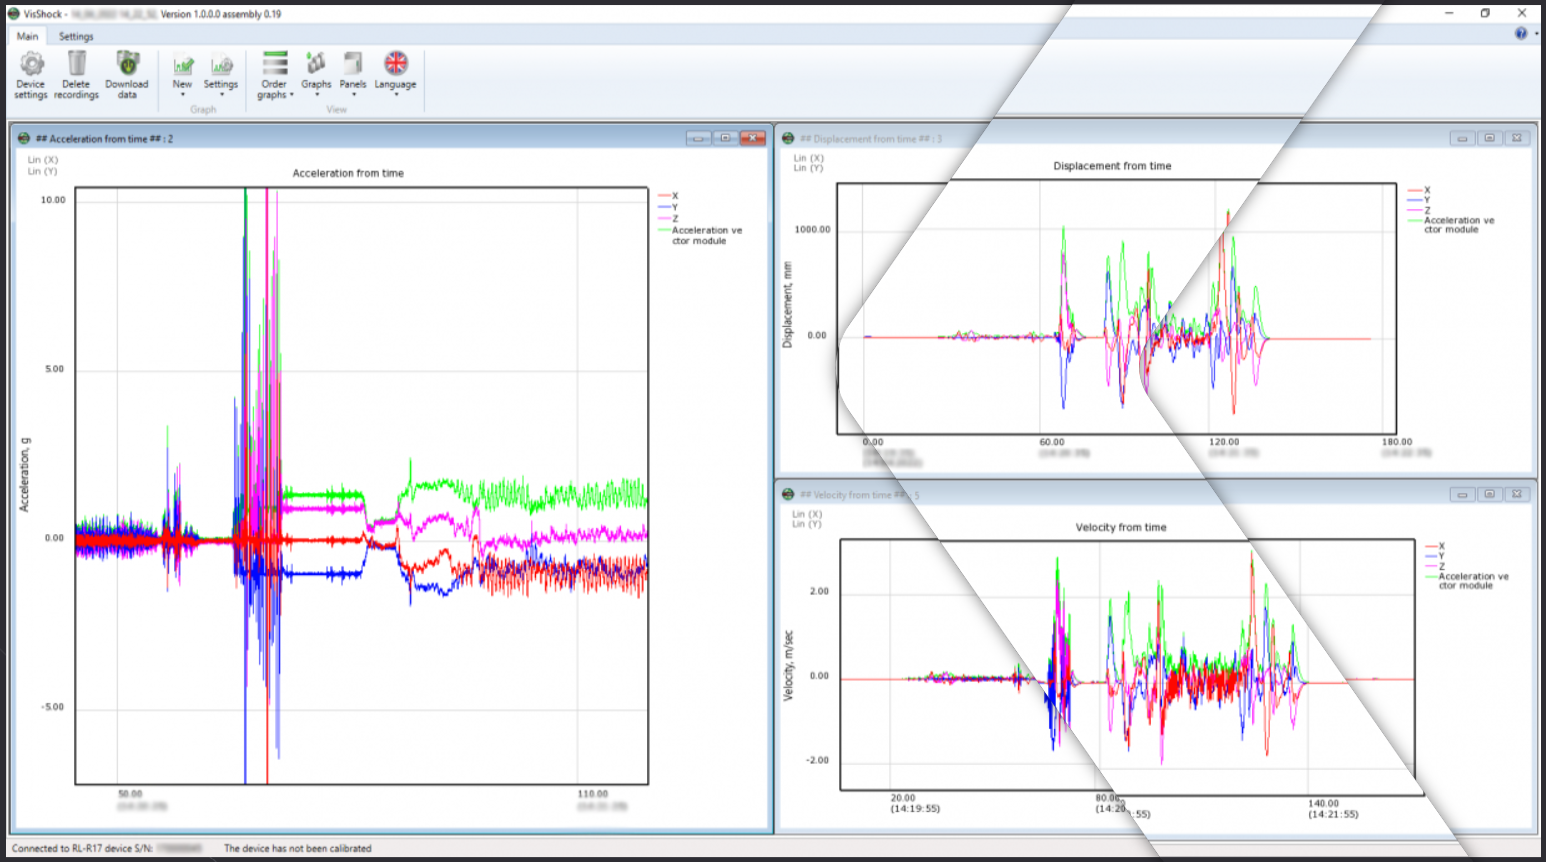
VisShock is a specialised Windows Vibration Impact Software. It operates with the RL-R17 shock recorder.
Firstly, it is a windows based software. It operates from Windows 7 and later. The control PC requires a processor: x86 or x64 with 2 GHz or more; 2 GB RAM; and at least 3GB of space on the hard drive. There are three options for installation: Hard Drive, Software CD or Website for registered users.
Specifications of Vibration Impact Software – VisShock
Continuous Recording Mode
The RL-R17 records all acceleration and temperature data. This provides a detailed picture for future analysis. It is only limited by the capacity of the internal memory of the RL-R17
It can produce a range of graphs. Such as:
- Acceleration vs. time
- Acceleration increment rate vs. time
- Velocity vs. time
- Displacement vs. time
- Acceleration vs. time without offset nulling
- Acceleration vs. time with offset nulling
- Frequency of maximum harmonica vs. time
- Maximum value vs. time
- RMS vs. time
- Offset vs. time
- Temperature vs. time
Shock Recording Mode
The device will only record shock events that exceed the shock start level set by the user. Recording ends automatically when the acceleration lowers to the shock end level. The user can define time related parameters such as time, indent, interval between recordings, maximum capture and shock level for each individual axis.
It can produce a range of graphs. Such as:
- Acceleration vs. time
- Temperature vs. time
- Plot of events – a histogram displaying the maximum of shock vs. time
- Graph of shock distributions – the graph shows the number of shocks against each amplitude range: 100 – 80 %, 80 – 60 %, 60 – 40 %, 40 – 20 %, 20 – 0 %
- Maximum shock
- Minimum shock
For more information, contact us.