This case study on “High Voltage Switch Testing with Synchronizer” was provided by our friends at Dewesoft. It was written by Gabriele Ribichini Managing Director at Dewesoft S.R.L Italy. To read the original article, click here.
Summary of the case study about high voltage switch testing with synchronizer
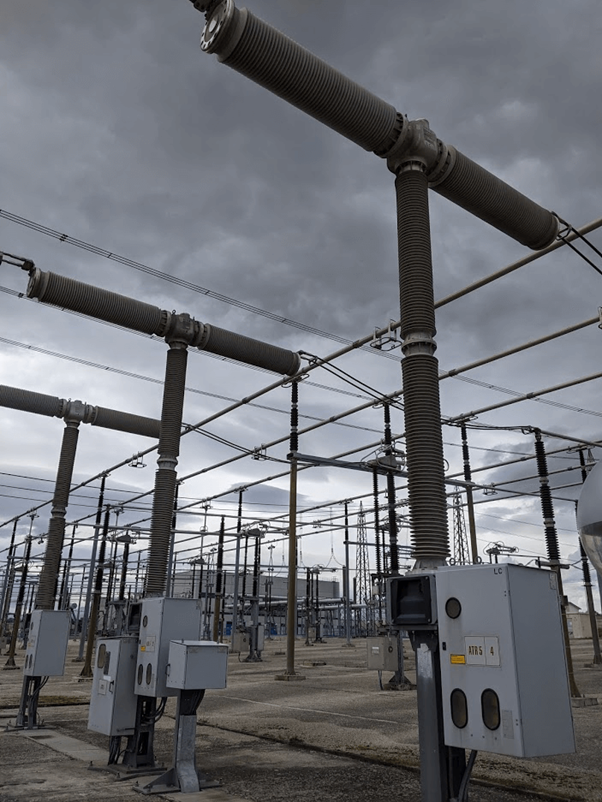
Circuit breakers are a critical component of power systems. Firstly, they prevent damage to the power systems components and wiring. Especially, when the current in the electrical circuit supersedes design limits. Italian transmission system operator Terna S.p.A. wanted to check the switching function of an older model synchronous high voltage circuit breaker. Dewesoft Data Acquisition Systems and Power Analysis software did the job.
About the customer
Terna S.p.A. is transmission system operator (TSO). They are based in Rome Italy. They operate through Terna Rete Italia which manage the Italian high voltage transmission grid. This is a network of 74,669 Km of lines with 888 electrical substations and 4 control centres. Managing 320 billion kWh each year.
What are Circuit breakers?
Circuit breakers are mechanical switching devices. They can make, carry and break the grid into normal and abnormal conditions. Abnormal conditions are considered events such as lightning striking a transmission tower. The circuit breakers isolate the faulty components of the system to prevent further damage. In a perfect scenario a circuit breaker should function as a perfect conductor to ensure optimal current flow.
The Synchronizer
A synchronizer is used in high voltage circuit breakers to avoid that the contact is open or closed, when the current flow is high. Opening a high current flow leads to electric arcs and reduces contact lifetime.
Firstly, the synchronizer knows the actuator delays. So, it observes the sinewave timing and gives a command to the breaker in a magic instant. This is calculated to have null instantaneous current when the contact moves.
Secondly, the same actuation is done on all three phases at different timing. This is because the three sine waves are shifted by 120°.
Initially, with a new instal the actuation is calibrated to work perfectly and preserve contacts during operations. However, over the years the open / closing time varies and the actuation occurs at the wrong time.
The purpose of the test
The purpose of this functional test was to analyse an older synchronous high voltage (HV) circuit breaker and check for possible movements from the initial set up.
The Measurement Equipment Use
- Dewesoft SIRIUS signal conditioning and data acquisition module – Model SIRIUSi-HS 4xHV, 4xLV
- Three Dewesoft AC current clamps – Model DS-CLAMP-15AC
- DewesoftX data acquisition software
- DewesoftX power analysis module
Picture 1. Dewesoft SIRIUSi-HS acquisition module is compact and robust and designed for out in the field operations
The module integrates signal conditioning functions. Such as AC or DC coupling selection, programmable gains, offset compensation (deriving from transducers), programmable LP filters, excitation of current probes and more. Including self-recognition of probes current and sensitivity to use.
One other important feature is the galvanic isolation at 1600V channel to channel and channel to ground.
Connecting the Instrument to the System
Firstly, three voltages were connected on the secondaries of the voltage transformers. The had a conversion ratio of 1:3800. Whilst three currents were captured downstream of the CTs with a conversion ratio of 1:800.
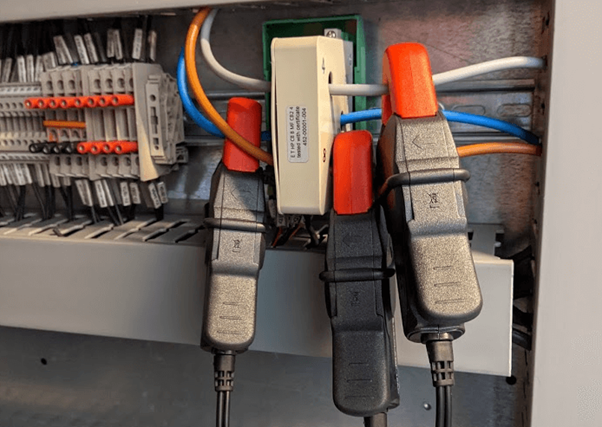
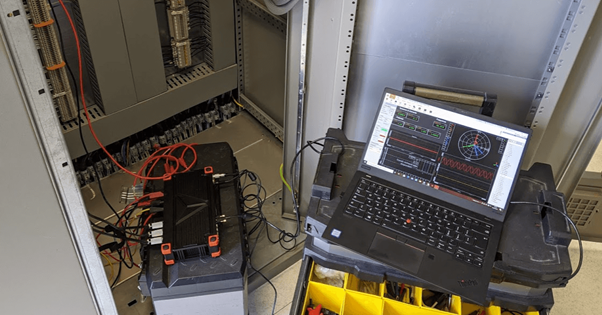
Figure 2. Connecting the instrument to the power system
Also two command signals (open and close) were sent by the synchronizer to the switch were also connected, signals at 110Vdc.
The Test
A typical circuit breaker closure test is divided into three distinct moments.
1. Energisation of the HV busbars
2. Closing of the no-load circuit breaker
3. Delivery on Load
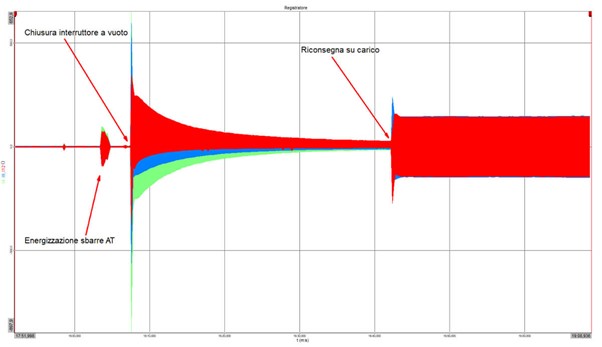
Figure 3. The circuit breaker three distinct moments
Energisation of the HV Busbars
The energisation of the high voltage bars is measured by a sequence of high frequency discharges over time.
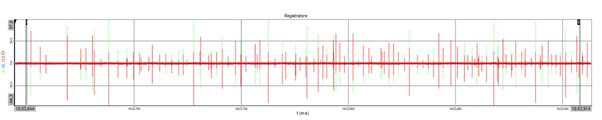
Figure 4. Sequence of high frequency discharges with time history measures the energisation of the HV bars
Closing the Switch
Analysis of Closing Times
By implementing the switch closure test shows the command signal that rises to 117 Volts in an instant.
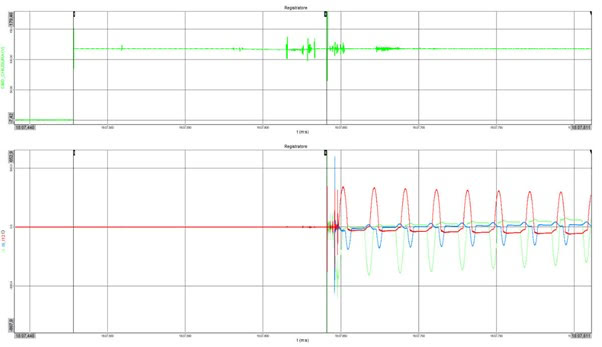
Figure 5. The switch closure test. The command signal is green signal at the top
So from the trend of the current signals, they are able to measure the activation delay equal to 163ms.
However, the detail of the current signals in the instant of closure highlights a concerning trend. Probably due to the triggering of discharges with current peaks up at 900A.
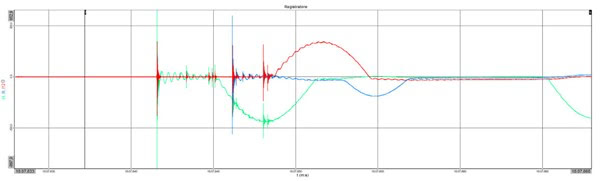
Figure 6. A detail of the current signals in the instant of closure highlights a possible issue.
However, it is soon recognised the absence of a load downstream from the switch is more likely the cause of distortions of the current signals following closure.
Figure 7. Distortions of current signals following closure – comparing three voltages and three currents
Behaviour Analysis of the Synchronizer
Detailed analysis of the switch switching, instantly highlights that the closure of the three phases does not occur at regular interface and in correct instants.
Phase 12 (red) is closed when the instantaneous voltage V12 is about 24kV. Then followed by phase 4 (after 4.3ms) when the instantaneous voltage V4 is about 234 kV and finally, phase 8 (after 1,89ms) when the instantaneous voltage V8 is -250kV.
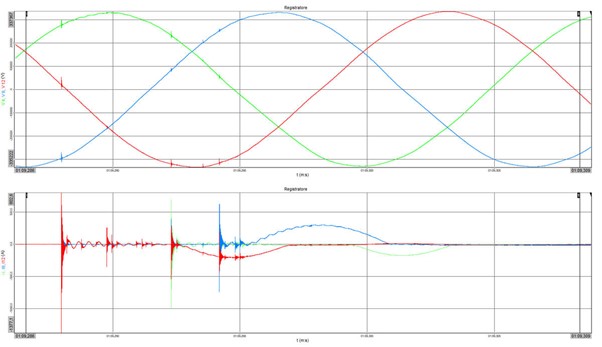
Figure 8. Analysis of the switch switching
Therefore, this behaviour causes electric arcs. Shown as peaks on the graph below.
Return on Load
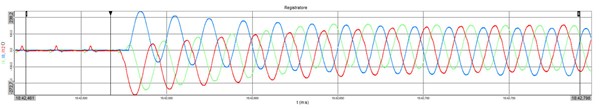
Figure 9. Upon delivery, the current signals assume a regular shape
Phasor Analysis
Phasor Analysis highlights the mismatches and imbalances in the three phases. The following figure shows the trend of the first harmonic voltages and currents (h=1, f=50.011Hz) with the switch closed and without load.
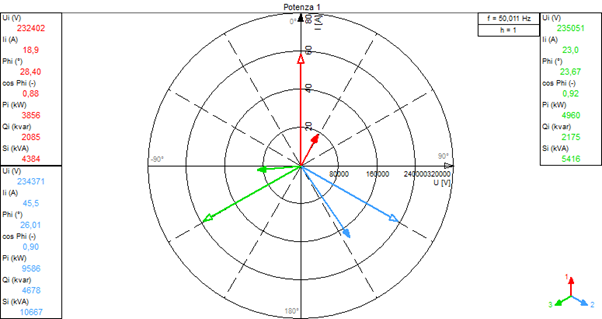
Figure 10. Phasor analysis
Harmonics Analysis
Harmonics Analysis highlights important distortions, which contributed to the achievement of PF 0.534.
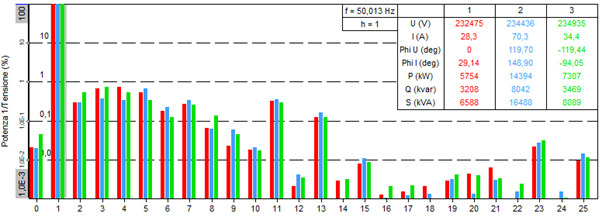
Figure 11. Harmonic analysis reveals distortions
Other
Parameters calculated by the DewesoftX Power module. It is a customisable power analysis screen. hown below.
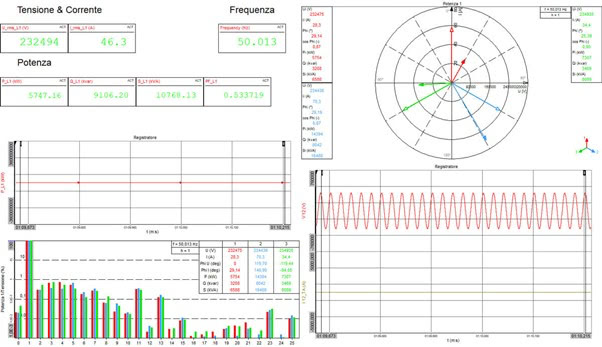
Figure 12. The DewesoftX standard power analysis screen
Conclusion
Therefore, from the tests carried out, it is clear that the synchronizer under test is not working correctly. Closing of the contacts does not take pace at the right moment causing important discharges with currents up to 900A.
Also the closure of the three contacts does not happen at regular intervals. The closing interval between phase 12 and 4 is 4.33ms while between phase 4 and 8 the interval is 1.89mx, a clear symptom of malfunction in case of steady-state periodic three-phase.
The analysis of phenomena with Dewesoft data acquisition easily allows verification of whether the product operating correctly. Another great feature is the ability to automate this verification with integrated sequences. DewesoftX software guide the operator on the process.
Regular synchronizers verification is easy to identify with aging problems. They usually require some maintenance to come back to normal operation. Correctly working synchronisers are important to preserve expensive contracts of HV circuit breakers.