This case study from Italy on Long Term Structural Monitoring of a Jetty using Operational Modal Analysis recently floated across my desk from Dewesoft and I felt that I needed to share it.
This application story was originally written by Giorgio Sforza from ESSEBI s.r.l To see the original, please click here.
Summary:
In the Italian harbour of Vado Ligure, the 800M Jetty is being continuously monitored by Dewesoft IOLITEd 3xMEMS-ACC Data Acquisition Devices. These devices will record structural conditions over time. Plus detect events causing a dynamic response using its integrated signal conditioners with built in MEMS accelerometers. Therefore, providing Modal Analysis. Ultimately, this analysis will report on the impact of the sea waves on the jetty structure. Also allow engineers to understand and optimise future solutions based on the dynamic behaviour of this structure.
Introduction:
Firstly, the Italian port of Savona Vado or Vado Ligure is in the North-Western Italian region of Liguria. Located west of Genoa in the northern most part of the Mediterranean Sea.
This large industrial and commercial port has piers for the loading and unloading of coal and oil. As well as a terminal, that provides ferry services connecting Savonna Vado with the islands Corsica and Sardinia.
Here, the structural health monitoring system is installed on an 800 metre long jetty in Vado Ligure. It is used to verify the behaviour of the structure, when impacted by rough seas.
The jetty is owned by Esso Italiana S.r.l. and allows tank ship loading and unloading. It connects via a pipeline to a berth. From which base oils for blending purposes are pumped to a lubricant plant for manufacturing processes, packaging, storage, and distribution.
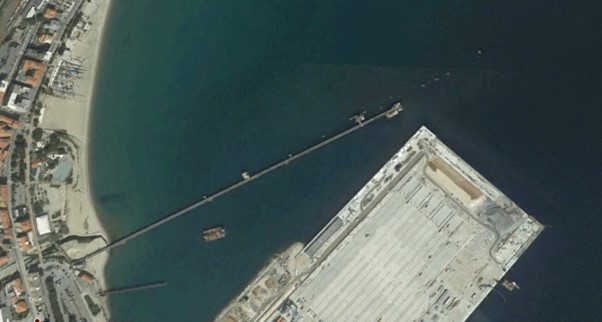
Figure 1. Aerial view of the pier from Google Earth.
Firstly, what is Modal Analysis?
Modal Analysis is a tool that allows engineers and technicians to understand the structural dynamics of an object. For example how the object behaves when vibration or force is applied. Modal Analysis allows machines and structures such as buildings & bridges to be tested, optimised and endorsed.
In structures, most vibration problems are related to structural weaknesses. Associated with resonance behaviour, nature frequencies and being excited by operational forces.
For many large structures, it is difficult to apply excitation using a hammer or shaker. Purely, due to their physical size, shape, and location. Also, these civil engineering structures are impacted by ambient forces which cannot be controlled or correctly measured. Such as wind, waves, or traffic.
Therefore, in some cases it is preferred to use the natural excitation of the structure. Under real operating and boundary conditions to determine its modal properties.
What is Operational Modal Analysis?
Operational Modal Analysis or OMA is measuring only the response of test structures under actual operating conditions. No artificial excitation.
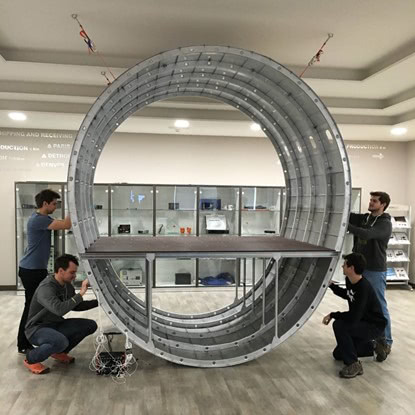
Dewesoft mechanical engineering team placing accelerometers and vibration shaker for OMA test in their headquarter R&D facility
Data treated with appropriate modal extraction algorithms will allow for the proper modal parameter identification.
Engineers & other professional staff identify modal parameters. Modal parameters are the natural resonance frequencies of objects, damping parameters and the visualisation of mode shapes. Modal identification determines the modal parameter’s characteristics of a structure. Therefore, a prediction can be made on how the structure will behave during external circumstances or events.
The parameters provide an “identity card” of the structure. Often used for validation of the calculation for that structure – for calibration or diagnostic purposes. Therefore, providing a base line in long term structural monitoring.
Finally, the advantage of Modal Analysis is the results from the testing enable architects, designers, and engineers to make improvements to the structure. Or add features to new designs which allow the product to perform better and last longer.
Measurements
The detection of dynamic parameters verifying structural conditions is available as reference at a precise time (T0).
Generally, this time=T0 for new structures can be taken at the time of testing. Whereas for existing structures, it can be taken as the time instant in which an assessment of the structural safety conditions is carried out. And in which the first measurements are made.
In this case study, the data were recorded by the system on two separate days. One was the completion of repair work on one of the poles on December 28, 2018. Therefore, evaluation of the effects of the repair interventions. As well as to have an up-to-date picture of the dynamic properties of the structure after the repair intervention. This picture was then used as a reference for the control of its state of preservation over time.
Dynamic Magnitude
The dynamic magnitude chosen for the measurements was the response of the structure in terms of acceleration. These were points arranged on the surface of the platform at the head of the pier. In particular, the points at the four vertices of the plan shape of the jetty platform, which were named with the letters A – D, were instrumented.
Each measurement point was instrumented with an IOLITEdi 3xMEMS-ACC, a three-axis accelerometer with axes XY oriented according to the directions of the horizontal plane and the vertical Z-axis. With reference to the plan layout of the platform. The X-axis is orthogonal to the development axis of the jetty and the Y-axis is parallel to the latter.

Dynamic Characterisation
For the dynamic characterisation of the structure, the accelerometric measurements were done on December 6, 2018, and January 4, 2019. Therefore, before and after the rehabilitation of the B1 pole of the platform. Each day, signals recorded for a 60-minutes. The modal characteristics of the structure are determined based on the accelerometric response within this interval.
The measurements completed with a sampling frequency equal to 100 samples/s. Anti-aliasing analog filter used. As well as a consequent bandwidth up to about 40 Hz. This allowed having a more than adequate frequency band concerning the expected frequencies for the investigated structure.
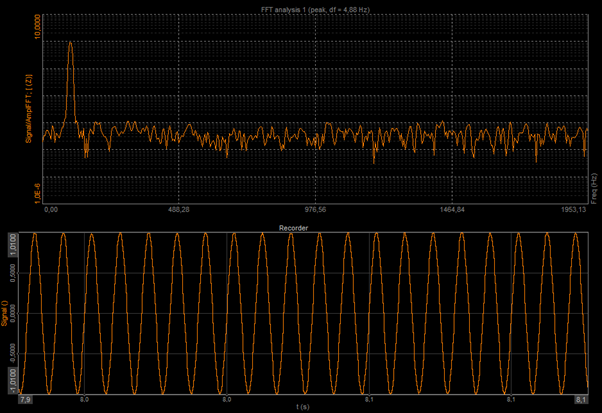
Dewesoft records vibration signals in the time domain while DewesoftX software converts the recorded signal into the frequency domain using Fourier transform
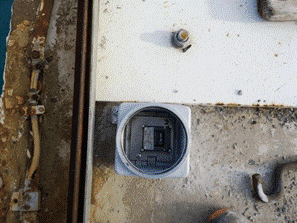

Figure 2. Photos of the installed instrumentation
Firstly, a simple geometric model, a single-line diagram, relative to the measurement points corresponding to nodes arranged in the space. Secondly, linked by lines – makes the perception of the shape more immediate.
As well as additional points added to simplify single-wire diagram (wireframe). Including the measured physical points A – D, simulating the base sections of the supporting poles.
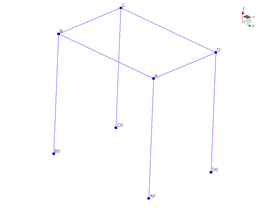
Figure 3. Wireframe geometric model of the pier
Results of Structural Monitoring of Jetty
The summary of the results of the measurements performed on 6 December 2018 and 4 January 2019, enables a quick comparison of the analysis attained in terms of frequency, damping, and prevalent direction of the associated modal form.
| Form | f [Hz] 6/12/2018 | f [Hz] 4/01/2019 | z [%] 6/12/2018 | z [%] 4/01/2019 |
| Translational X | 1,171 | 1,224 | 1,15 | 1,10 |
| Torsional | 1,303 | 1,385 | 1,22 | 2,27 |
| Roto translational Y | 1,453 | 1,514 | 1,69 | 1,85 |
| Translational Y | 1,717 | 1,845 | 2,24 | 1,78 |
Table 1. Summary of reference measurement results
The frequencies determined from accelerometric response on 4 January, following the repair operation performed on the B1 pole, are higher than those determined on 6 December. In Summary, with an increase of between 4 and 7%.
So, the modal forms do not appear to change between the two elaborations. Therefore, the modal parameters of this study of the structure shows an increase in rigidity following the restoration of the poles.
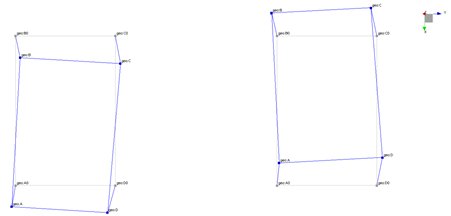
Figure 4. Translational modal form X
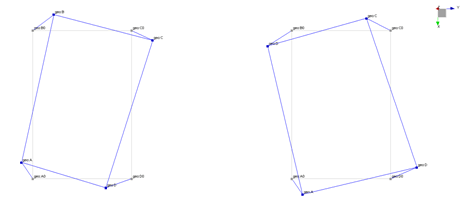
Figure 5. Torsional form
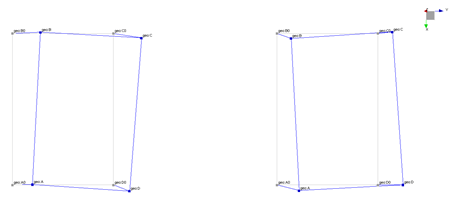
Figure 6. Roto translational modal form Y
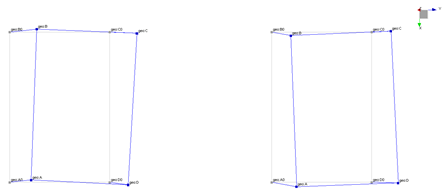
Figure 7. Translational modal form Y
Conclusion
In conclusion, this method provides for the calculation at regular intervals of the specific frequencies of the structure. Therefore, the continuous structural monitoring and comparison with the data obtained at the initial time taken as reference.
Due to its low costs and short realisation times, the methodology of Operational Modal Analysis (OMA) is increasing in use in the civil engineering sector to characterise the dynamics of a structure.
For more information on this application or on the product used, contact us.