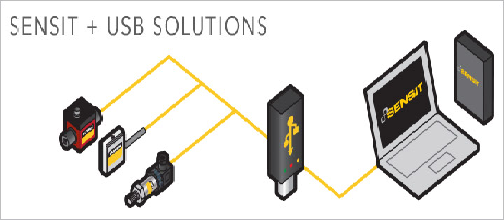
The SENSIT Software captures all your test and measurement data via USB Technology.
It displays the Peak/Valley, Tare/Gross and enables full data logging and graphic capabilities. USB520 operates with other software such as LabView® and Visual Studio.
IHH500 Handheld Display offers the same data analysis as it does for the USB Technology mentioned above. However, when coupled with the handheld display or any other signal conditioner, it becomes a turnkey load cell data acquisition system. An extra advantage of the IPM650 Panel Mount Display is the ability to remote access the display as well as graph and log data.
Features of the SENSIT Test and Measurement Software
- Designed to display and record measurements made by USB Sensors
- Simple display with four tabulated sheets separating core functions of program
- Data logging feature for measuring and tracking tests
- Record Data and convenient excel export function
- Built in calculator tool for involved maths calculations
- Core features include: tracking, peak valley, tare, gross, decimal point format, unit conversion, sampling rate, average, linearisation, shunt verification, display refresh rate, sum and maths channel
- Measure activity of up to 16 different sensors in same platform
- Right Click Mouse for easy access to menu
For more information, contact us.
