Historian Time Series Database
Historian Time Series Database Software provides storage for long term and permanent monitoring. It also reliably transfers data from multiple measurement units into an InfluxDB time-series database. A server or cloud hosts this database while a web browser or DewesoftX software gives users access to the data. Alternatively, users can stream and analyse data in real time. Examples of data that Historian can monitor, and store include:
- Vibration
- Temperature
- Inclination
- Strain
- Pressure
- Other data with self-hosted or fully cloud managed service
Furthermore, the OPC UA protocol allows communication between Historian and the DAQ hardware. As a result, users can access data via DewesoftX, SCADAs, ERPs or any other OPC UA client thanks to Historian’s ability to write or read data into the database before it transfers it to clients. Thus, giving users worldwide access while maintaining reliability, usability and expandability.
InfluxDB
A state-of-the-art time-series database, based on InfluxDB open source lies at heart of Historian. This state-of-the-art time-series data base is what makes Historian perfect for the long-term monitoring and storage of data. Furthermore, since InfluxDB is written in Go; it’s fast and retrieves time series data fields at high-availability storage rates. For example, data fields include operations monitoring, application metrics, Internet of Things sensor data and real-time analytics.
Furthermore, Historian can save the following channel types for an unlimited time-span:
- Synchronous 1D channels
- Asynchronous 1D channels
- FFTs and Scope shots as asynchronous 2D channels
Data Visualisation
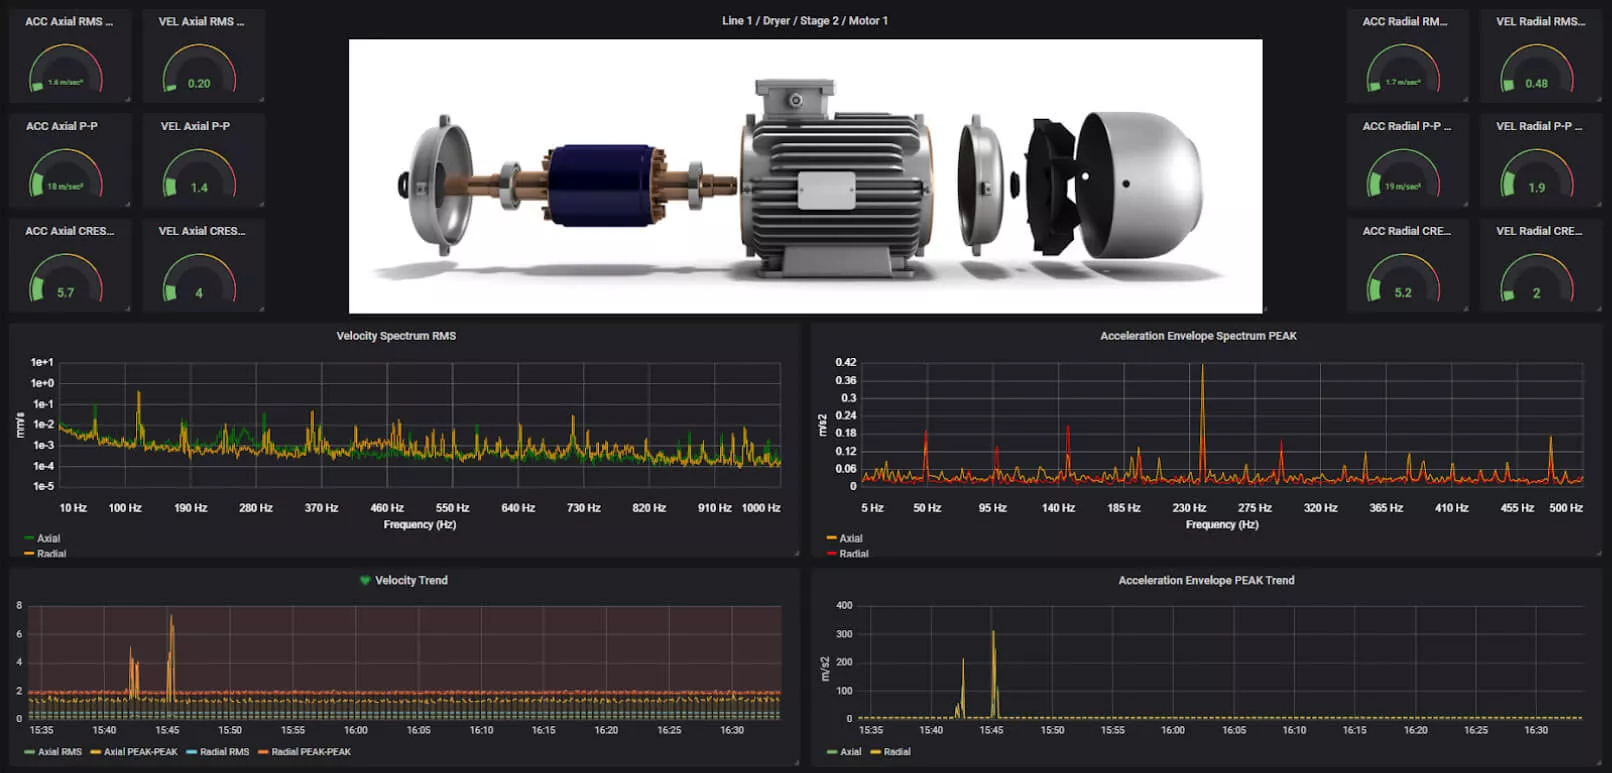
Grafana, another open-sourced product, is part of Historian’s design. It provides visualisation of long-term data. It also makes data accessible on any platform. For example, accessible platforms include Windows, Linux and Mac OS on desktop or mobile devices. As a result, it’s an ideal solution for a data dashboard.
Furthermore, Grafana provides comprehensive visualisation capabilities for trend data and live values. As a result, Dewesoft developed 2D channel visualisation extensions for Grafana to display FFTs and high-speed waveform scope shots.
In addition to this, Dewesoft also developed a Python-based Grafana Connector. By adjusting the data density shown, this connector optimises data loading for long and short time intervals.
Finally, basic math, threshold levels and email alerting are available for set up on any display. Visual displays in Grafana are also available as part of a turn-key solution.
Data Safety
In case of network failure or downtime, measurement units will continue to store into the local buffer. Then, once the historian re-establishes a connection, data transfers into the database. Please note that tolerated offline time depends on the buffer size, data rate and available network bandwidth on reconnect.
Furthermore, the database can also store specific amounts of data for specific periods of time. Users can reduce the amount of data stored by taking the average of the higher data rate samples and down sampling. Likewise, Influx DB configuration scripts via SQL language can configure duration rates.
Key Features of the Historian Time Series Database include:
- Time-Series Database: A state-of-the-art open-source InfluxDB database stores data. It is fast and has high-availability storage and retrieval of time series data. As a result, making it perfect for operations monitoring, application metrics, Internet of Things sensor data, and real-time analytics.
- Self-Hosted or Fully Managed Hosting: Historian service can either be installed locally on the measurement unit, on your local intranet or Metromatics/Dewesoft can provide a fully cloud-managed service. Please note, a monthly fee applies for fully hosted managed services.
- Accessible From Anywhere and Anytime: Data stored in the Historian database can be accessed from anywhere in the world and at any time using an instance of DewesoftX data acquisition software or any standard web browser on any device like computer, tablet or smartphone.
- Visualisation In Grafana: Historian uses another great open-source project called Grafana for visualisation of the stored data. Grafana is multi-platform open-source analytics and interactive visualisation web application. It provides charts, graphs and alerts for the web when connected to supported data sources. It is expandable through a plug-in system. End users can create complex monitoring dashboards using interactive query builders.
- Data Safety and Re-Transmit: In case of a network failure or downtime, the measurement units will continue to store the data into the local buffer and will safely transfer the data to the Historian database when the network connection is re-established.
- Raw and Reduced Data: While raw data is always stored on the measurement unit for an in-depth analysis, Historian takes the role of long-term reduced data storage into the cloud database.
- Trending and Analytics: Historical data can always be recalled and loaded from the Historian database and used for trend analysis as well as for in-depth analysis and root cause identification.
To get the technical breakdown of the Historian Software, click more information. Otherwise contact us, we would love to chat to you about this great product.
Finally, Metromatics proudly sell, service and support the Dewesoft product range in Australia and New Zealand.


